What you thought worked well when using Excel to record data?
Inputting data is always a dream with Excel, however, I always want to put in more data than can in one graph, where it’s practical, visible or not. The size of the graph is easy to manipulate and can be resized by the viewer to maximum visibility. I packed this one pretty tightly to get all four graphs into the document.
What you thought didn't work well when using Excel to record data?
I first used the graphing feature when preparing reading improvement statistics for the school board years ago and so know how I have to manipulate the presentation to make things clear. That means I repeat the identification line (the chronological order in this case), in order to get a consistent and easily readable set of graphs. I couldn't pate either the Excel chart of the graphs into this document.
How using maps, charts, and graphs can help describe findings and help people understand findings.
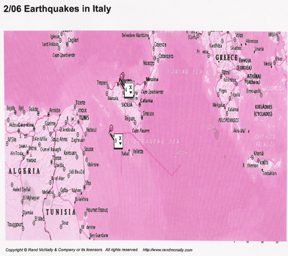
Of course, the visual presentation on a graphic within the context of the subject matter, for example, earthquakes, makes the issues and events clear in ways descriptive words and essential charts can never do justice.
I used old mapping software from Rand McNally. I thought it was the best solution. Though I could not save the map I thought I could print the labeled map, scan it and upload that to you. The map wouldn’t print correctly. When I copied it, I lost all of the labels. I finally copied it into Adobe Photoshop and relabeled the points as closely as I could without benefit of the longitude and latitude read out that I accessed in the map program. Here, I have uploaded both maps. I do think that something is amiss with the software and my printer. You can see that the map is distorted and doesn’t fully display my data in the print out. All of the data was visible on screen from the program.
What mapping software did others use?